
Building Heatmaps at Scale
From Session Replay to Interactive Visualizations

The 256 Character Problem That Almost Broke Our Heatmaps
Imagine trying to locate specific DOM elements involved in millions of user interactions, spanning countless page states and screen sizes. You’d need element data, like tag names, IDs, class lists, and ancestor hierarchies, to reliably match to a clicked button across a mobile viewport and a 4K desktop display. But the API that needs to support querying this element data has a hard 256 character limit for property values, and your solution needs to scale to of millions of user interactions daily.
This was just one of several interesting technical challenges we encountered while building heatmaps at Mixpanel. Building what appears to be a straightforward visualization feature turned into a deep dive through coordinate system transformations, API workarounds, and the fundamental question of how to visualize user behavior across wildly different screen sizes and page layouts.
Pixels or DOM Elements, why not both?
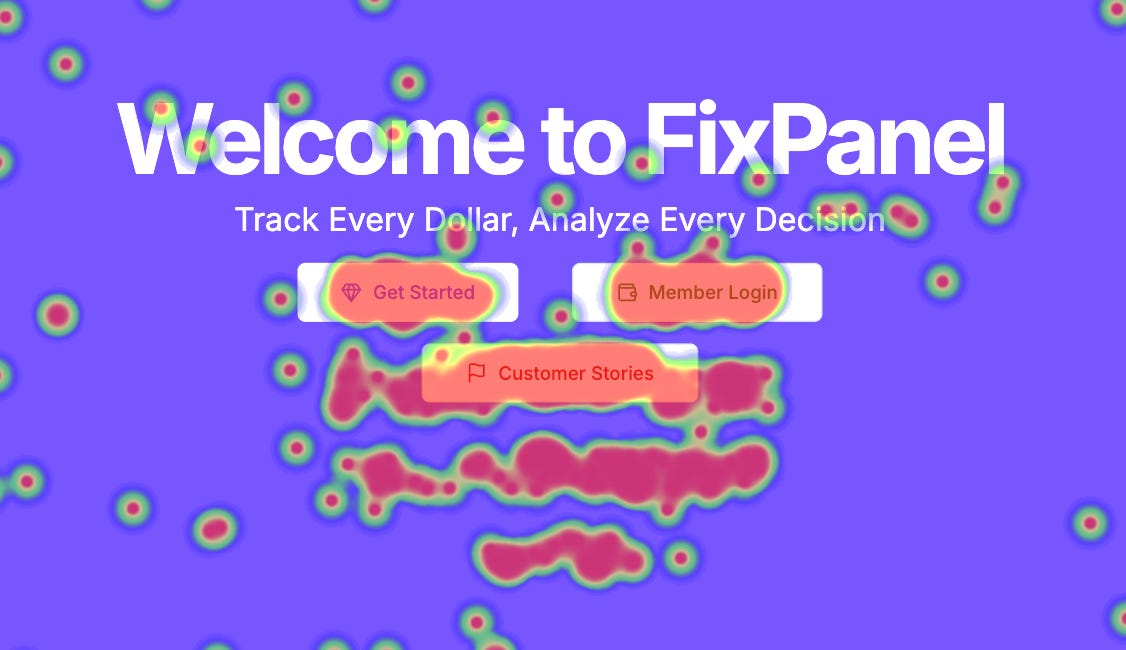
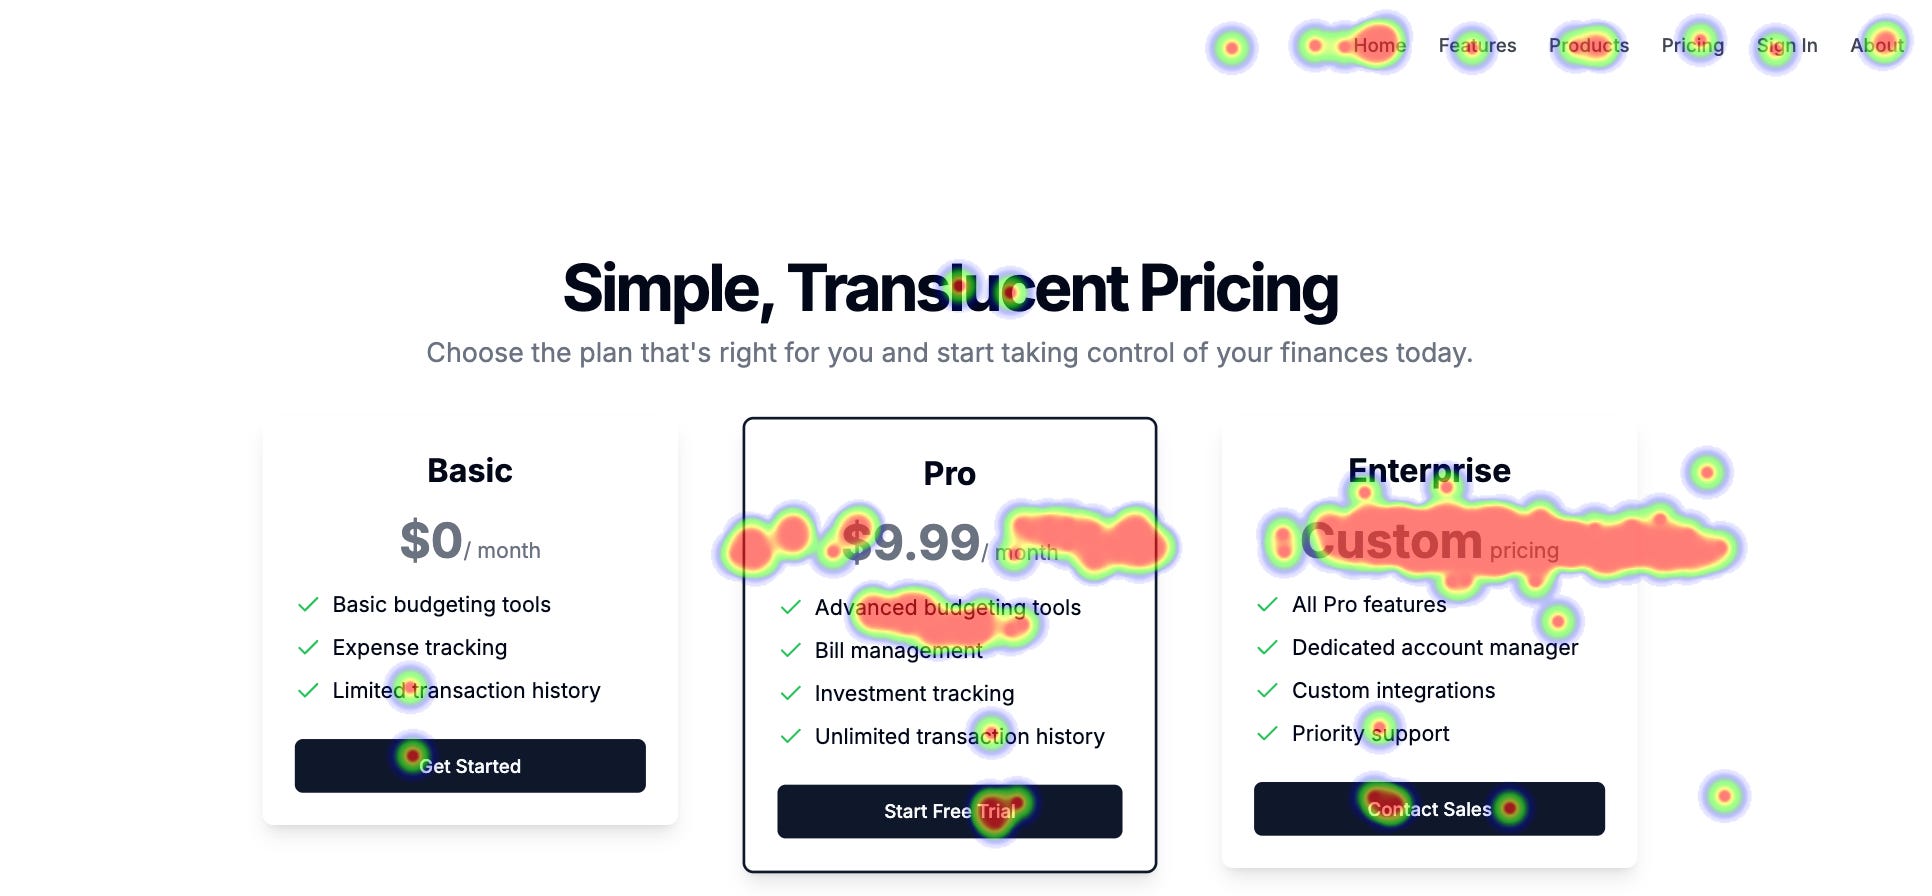
Heatmaps are visual representations of user interactions on web pages, and we built support for two distinct approaches. Traditional heatmaps use x and y coordinates to create color gradients showing interaction density, with warmer colors indicating more activity in a given area.
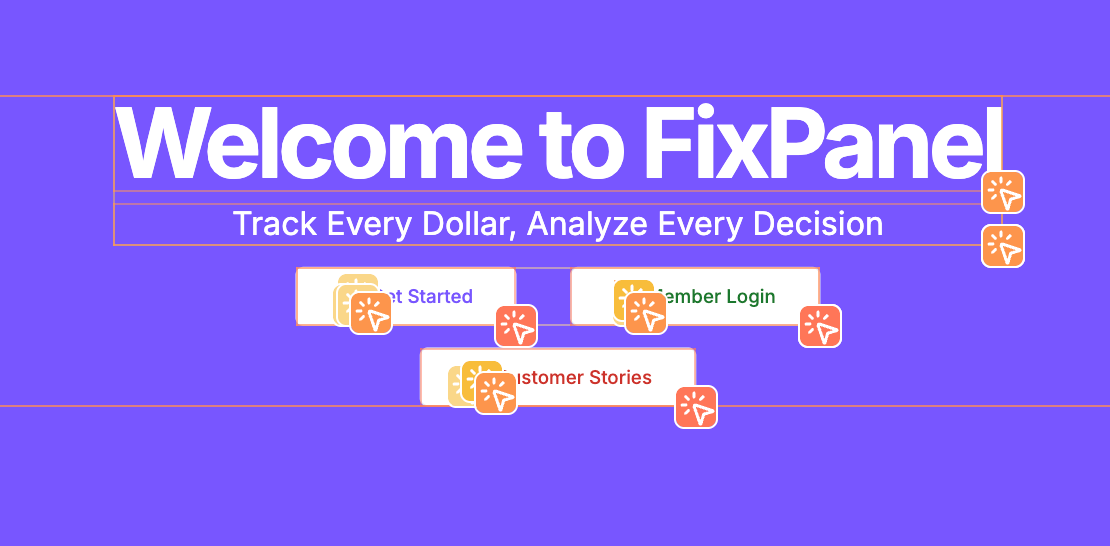
Clickmaps, on the other hand, identify specific DOM elements that were clicked and display boxes around them, making it easy to see exactly which buttons, links, or other content areas received the most attention.
From Individual Sessions to Aggregate Insights
Mixpanel’s Heatmaps emerged from a clear customer need. While our Session Replay gives teams insight into individual user journeys, customers wanted to understand interaction patterns on their pages across many sessions. Marketing teams needed to see where users engaged most on landing pages. Product teams wanted to identify confusing UI elements and flows.
For us, this wasn't just another feature. It was table stakes for competing in the modern analytics landscape where understanding user experience is as important as understanding user behavior.
Building on Giants: Session Replay + Autocapture
Our heatmaps architecture leverages two existing Mixpanel products, both offered through the Mixpanel SDK. Session Replay uses an source framework called rrweb to record JSON representations of the DOM, starting with an initial snapshot and tracking subsequent mutations. This approach gives us a complete recreation of user sessions that we can use as backdrops for our heatmap visualizations.
For the data to layer on top, we turned to Autocapture, another Mixpanel product which runs alongside Session Replay, which uses event listeners to capture user interactions like clicks and scrolls. When both systems are active, these interaction events get tagged with replay IDs, connecting both kinds of data.
This foundation gave us the two key ingredients for heatmaps. A visual backdrop (the replay) and the interaction data to plot on top of it.
A 256 Character Limit and Three Coordinate Systems
Challenge 1: The Query Limits Problem
To build clickmaps, we needed a way to pass DOM element data through our analytics pipeline. This led us to design the $elements property, a JSON array containing data about the clicked element and its ancestors. But we quickly spotted a problem. The Mixpanel Query API, which powers all Mixpanel analysis, has a 256 character limit for property values imposed by the architecture of Arb, Mixpanel's in-house event analytics database. Changing a core database constraint like this would have been risky and expensive.
"$elements": [
  {
    "$classes": [
      "add-button"
    ],
    "$nth_child": 1,
    "$nth_of_type": 1,
    "$tag_name": "button"
  },
  {
    "$classes": [
      "button-container"
    ],
    "$nth_child": 1,
    "$nth_of_type": 1,
    "$tag_name": "div"
  },
  more ancestors...
  {
    "$classes": [
      "mobile-optimized",
      "new-chrome",
    ],
    "$nth_child": 2,
    "$nth_of_type": 1,
    "$tag_name": "body"
  }
]
We needed at least 5 ancestor elements to reliably match a click across different page states, but even this often exceeded our limits, resulting in data being truncated. Our solution leveraged Custom Properties, an existing analytics feature that allows our customers to transform their data during queries. Using this, we restructured our element data query to prioritize the information that was most relevant to get a match. Element tag names and IDs come earlier and styling information comes later. When truncation happens, we lose the least important data while preserving as much as possible for accurate element matching.
displayFormula = `$elements[${index}]["$tag_name"], $elements[${index}]["$id"], $elements[${index}]["$classes"]`This approach improved our match rates significantly while staying within the API’s constraints. This unlocked clickmaps, but querying the data was only the first rendering challenge we encountered.
Challenge 2: The Multi-Coordinate System Problem
Rendering traditional heatmaps requires locating a click’s position across three different coordinate spaces, the original page where the interaction occurred, the rrweb DOM of our current backdrop, and the scaled display in our editor interface.
A click recorded on a 1920px wide desktop needs to be positioned accurately when displayed on a 1366px wide backdrop from one of the available session replays, then scale correctly when shown in a 800px wide editor panel. We solve this by using each click's $pageWidth and $pageHeight properties to convert positions to relative coordinates, and then scale those to match our current display dimensions.
The complexity increases with responsive layouts and dynamic content. A click on a desktop version of a website might have coordinates that don't make sense in the site’s mobile layout. Our solution embraces this complexity rather than fighting it, which leads us to our third challenge.
Challenge 3: Choosing the Right Visualization
We quickly realized that no single visualization approach works for all use cases. Traditional heatmaps work well for marketing pages with stable layouts. But they become inaccurate with dramatic screen size differences or dynamic content like modals and dropdowns.
Clickmaps solve many of these issues by matching interactions to specific DOM elements and drawing precise boundaries around them. They're far less affected by screen size variations and adapt to dynamic content. However, they're less intuitive at a glance and vulnerable to website changes that alter the DOM structure.
Rather than forcing a choice, we built both on top of the same click data source. By eating the cost of providing both together, we allow customers to switch between traditional heatmaps and clickmaps seamlessly depending on their page type and analysis needs.
From Raw Events to Interactive Visualizations
Now that we understand the challenges, let's see how the full flow fits together. The implementation pipeline starts with rrweb events flowing to our Session Replay APIs, while Autocapture generates click events tagged with replay IDs and all the data needed for matching. When a user creates a heatmap, we query the Mixpanel Query API for clicks matching their chosen URL pattern, grouped by the properties we need for visualization.
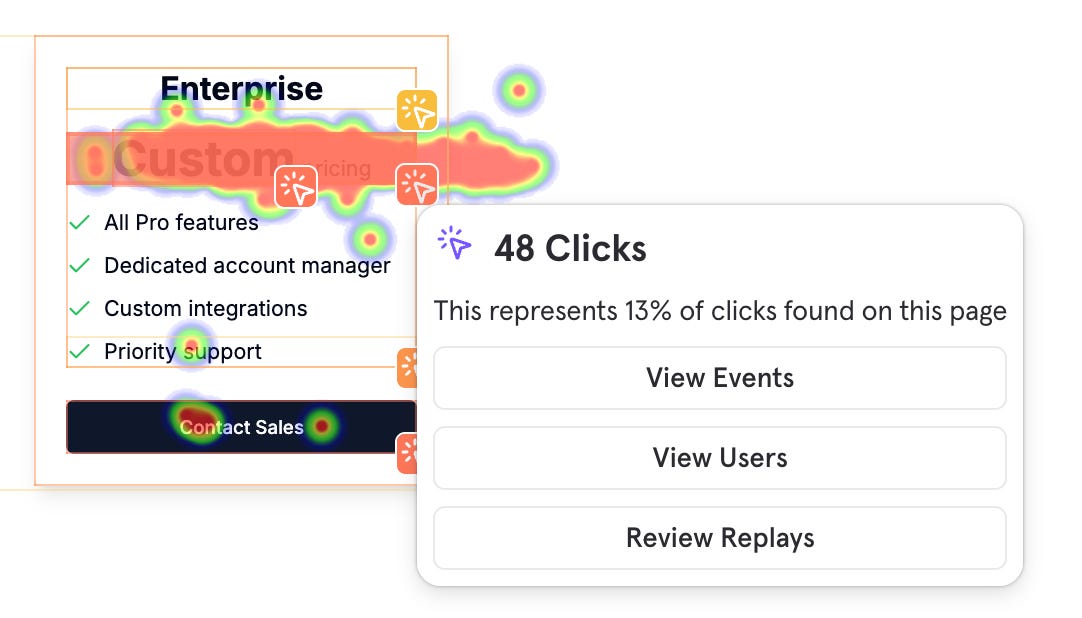
With the click data in hand, we fetch corresponding replays as backdrop options and render the Session Replay player in a paused state. For traditional heatmaps, we feed the normalized click positions to a library called heatmap.js, which generates a canvas overlay on our backdrop. For clickmaps, we use the $elements data to query the replay DOM, calculate bounding boxes for matched elements, and render interactive overlays that users can use to explore deeper.
The entire pipeline from raw interaction to visual insight happens in near real-time, turning millions of individual user actions into actionable insights for our customers.
The Future of Heatmaps
Looking ahead, we're excited about extending heatmaps to mobile session replays and exploring ways to automatically surface heatmap insights using LLMs. Imagine heatmaps that don't just show you where users click, but intelligently summarize patterns and suggest optimizations! The future of heatmaps at Mixpanel is exciting and undoubtedly full of many more interesting challenges.
Join Us in Solving These Challenges
Problems like these where we need to balance technical constraints with user needs, build systems that work across many different environments, and make complex data intuitive are what make engineering at Mixpanel a fulfilling endeavor. If you're excited about tackling challenges at the intersection of data infrastructure, user experience, and large-scale systems, we'd love to have you on the team.
Check out our careers page for current openings. We’re hiring!