Tracking Your AI Product - Best Practices
As AI continues to reshape software products, understanding how users interact with AI features has become more critical—and more complex—than ever. Traditional product analytics focused on button clicks and page views is no longer sufficient to capture modern usage patterns like free-form prompting or dynamic AI responses.
The opaque nature of AI systems, particularly LLM-powered features, makes measuring user experience harder—but also more essential. Strong analytics isn't a luxury; it's foundational to iterating quickly and delivering value in AI-native products.
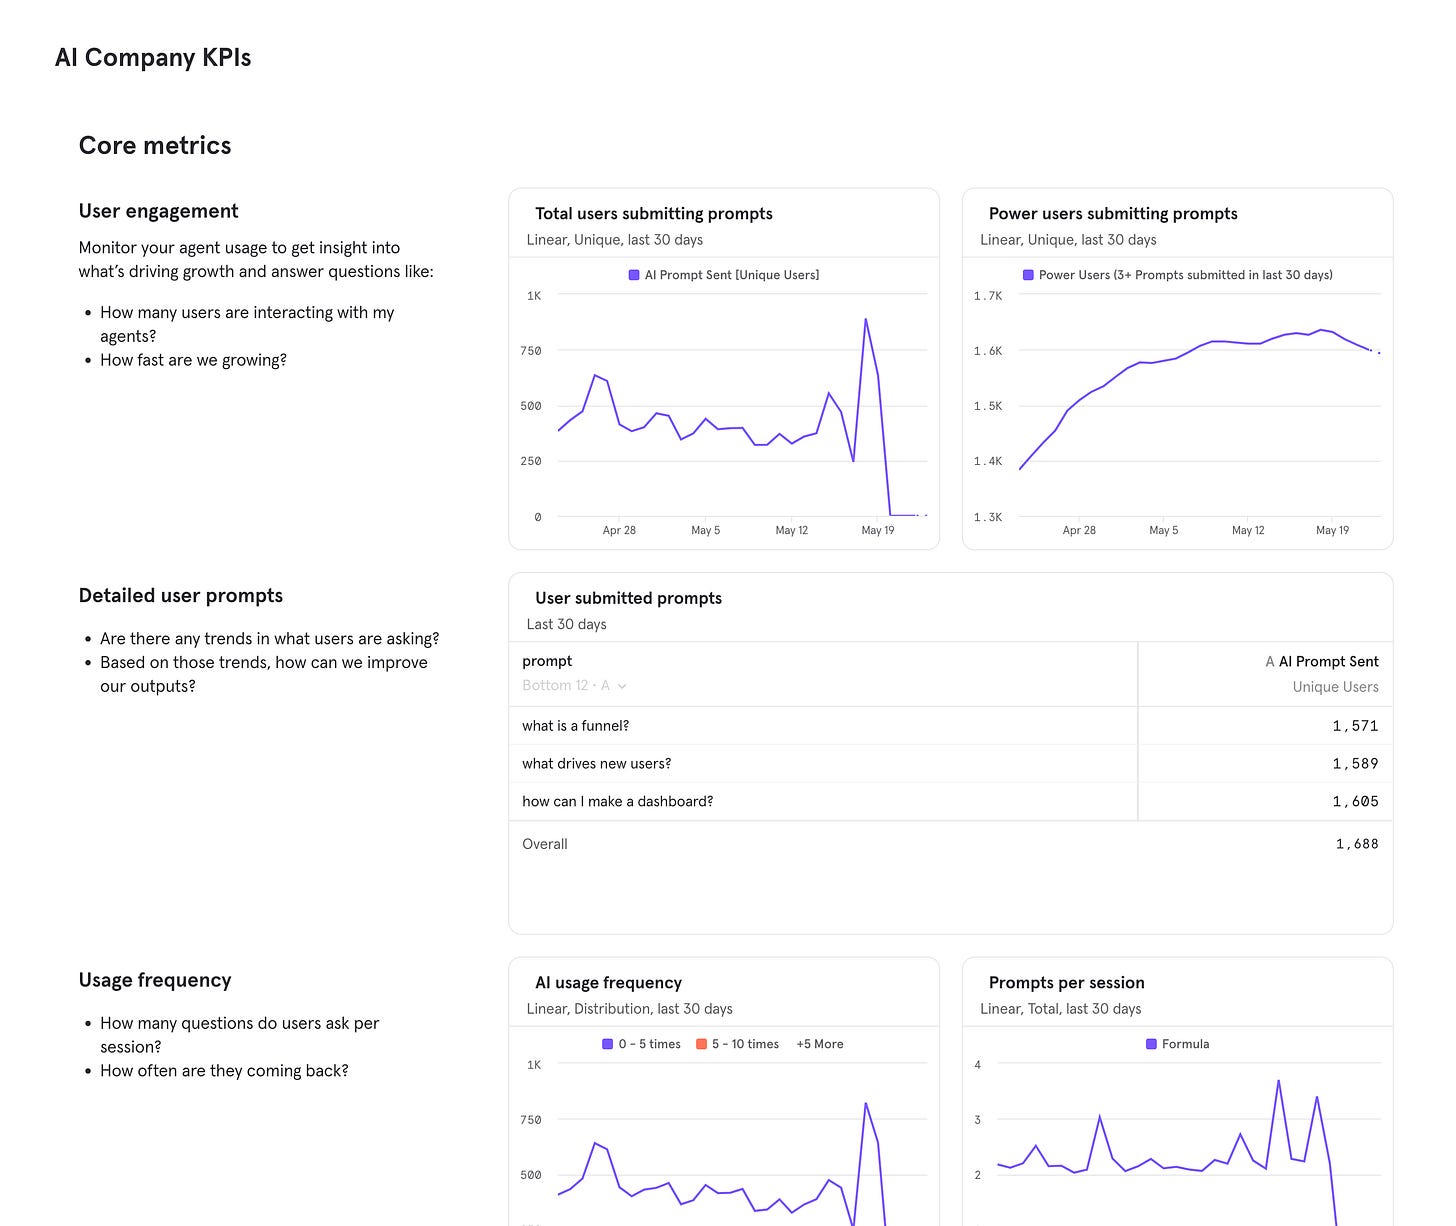
At Mixpanel, we’ve been talking to leading AI product teams to understand how they measure success, and we’ve applied those learnings to our own AI product, Spark AI. This post shares the most valuable metrics we’ve found and how you can implement them using Mixpanel—plus, we’ve bundled it all into a dashboard template for AI teams to help you get started.
What Events to Track for Your AI Product
Before we can build a dashboard, you need the right event data. Below is a recommended baseline schema for AI products—particularly LLM-powered interfaces like chatbots, copilots, or agents. These events give you full visibility into how users interact with AI features, and how well those features are performing.
Each event includes properties to capture deeper context—critical for debugging, performance tuning, cost analysis, and user behavior insights.
Why Accuracy Should Be Your North Star
Across every AI team we spoke with, one theme was consistent: accuracy is the core metric. If users don't perceive the AI’s output as useful or correct, they won’t come back—no matter how clever the model architecture or UX is. This directly impacts engagement, retention, and ultimately revenue.
But accuracy is notoriously difficult to quantify in the real world. Offline evals have their place, but your users aren’t running benchmarks—they care about whether the AI helps them solve their problem.
That’s why we recommend tracking several proxies: user engagement, behavior patterns, qualitative feedback, and retention. Together these can tell a robust story about how well your AI is performing in production.
Core Metrics: Understanding Usage, Engagement & AI Performance
These are the foundational metrics every AI product team should be tracking. They help approximate real-world accuracy, measure stickiness, and surface areas for prompt tuning or model updates.
These metrics are especially useful for fine-tuning LLM prompts, surfacing prompt failure patterns, and informing changes to your user experience.
Cost & Performance: Ensure AI Is Driving ROI
Running LLMs at scale is expensive. Even if you're using API-based services like OpenAI, costs can spiral quickly. You need to understand how AI usage translates to value, and where inefficiencies lie.
Mixpanel complements your LLM observability tools by connecting costs to user behavior—so you can see not just what you're spending, but whether it's worth it.
Linking LLM cost data with Mixpanel usage metrics helps you answer: Which features are worth scaling? Which aren’t?
Beyond the Prompt: Feedback, Flow & Post-AI Behavior
Many product teams overlook what happens around the prompt—before and after AI interactions. This context is critical for diagnosing drop-offs and optimizing user experiences.
While feedback rates are typically low, qualitative feedback is invaluable for identifying failure cases or emerging use patterns.
Final Thoughts: The Right Metrics Drive Better AI Products
Startups and AI product teams don’t have time to waste—especially in an environment that’s evolving this quickly. The best teams treat analytics not as a retroactive reporting tool, but as a real-time compass for iteration.
The metrics above won’t give you all the answers—but they’ll give you the right questions to ask, the right signals to track, and the ability to make smarter, faster decisions.
👉 Use our AI analytics dashboard template to get started in minutes.


